

Our stacking plans and portfolio summaries turn certified BOMA area data into clear, actionable visuals. They help you see the whole picture; floor by floor, building by building, with every rentable square foot accounted for.
Portfolio Clarity Through Verified BOMA Data
When Stacking Plans Add Real Value
Stacking plans are most useful when your property - or your portfolio - gets complex.
They bring BOMA data together across multiple floors or buildings, showing how rentable area, occupancy, and lease exposure align across your assets.
They’re ideal for:
Large or mixed-use assets with complex tenant distributions
Acquisition, refinance, or ownership reporting
For many buildings, stacking plans often add little insight. But on large or complex projects they can provide insight that can come from a new perspective on the data.
We can also customize stacking diagrams to track lease rollovers, vacancies, or even target vs leased RSF when you are transitioning between measurements.

Driven by Certified BOMA Geometry
Every stacking plan begins with colorized area plans generated in Revit, using the same geometry certified in your BOMA measurement.
These drawings are directly linked to the Excel data in your BOMA report—keeping the visuals and numbers perfectly aligned.
For multi-building portfolios, we consolidate everything into a summary workbook where each building tab uses consistent classifications, load factors, and RSF calculations.
Deliverables That Bridge Geometry and Data
BOMA Report Tools that help visualize the data
Each diagram and table ties directly to certified BOMA data to ensure cross referenced accuracy.
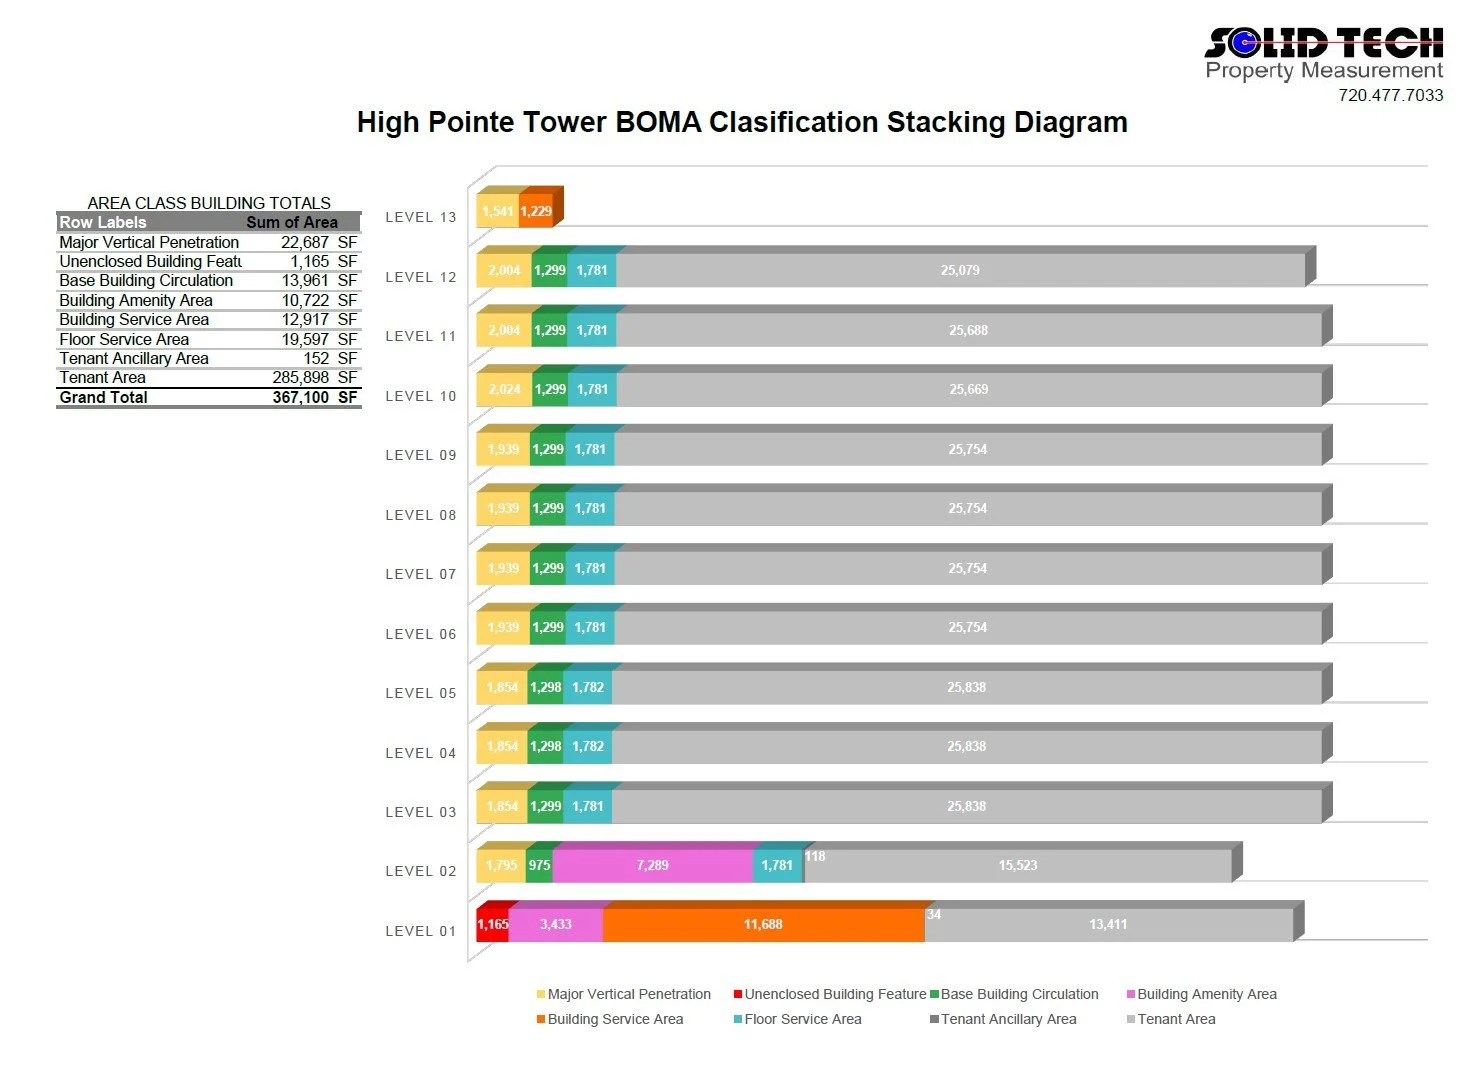
Colorized stacking diagram by tenant and / or BOMA space classification
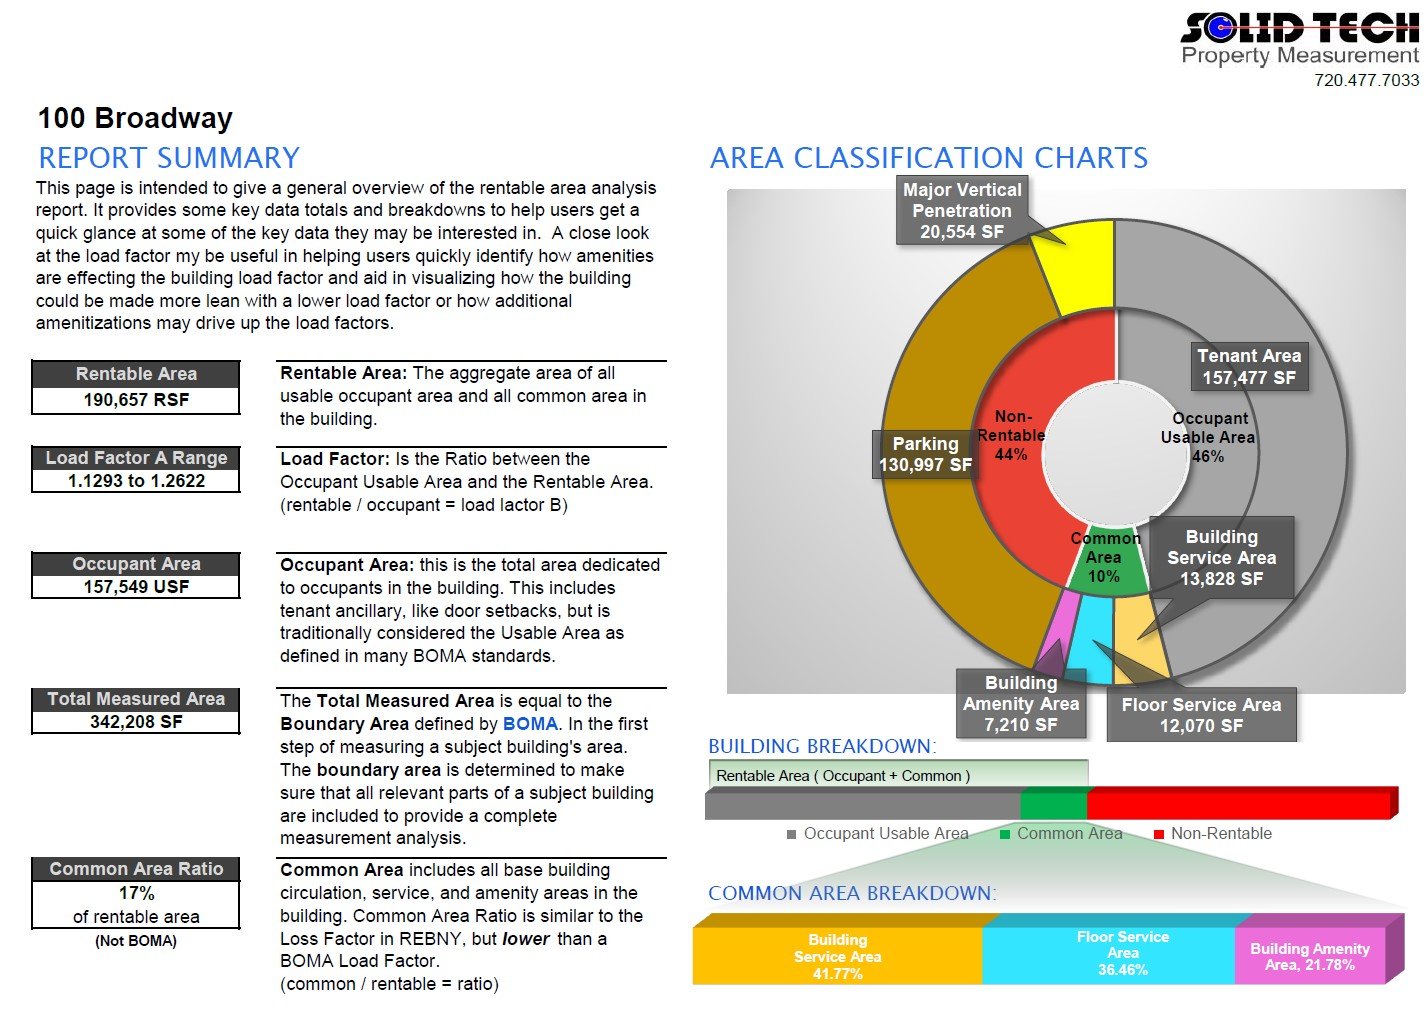
Portfolio summary table showing RSF, load factors, and occupancy across buildings
Lease Exhibits by each tenant space for inclusion with lease agreements
Marketing Plans
Presentation-ready PDFs for ownership, lenders, and investors
Consistent RSF = Better Portfolio Decisions
When every property follows the same measurement standard, lease renewals, valuations, and recoveries become simpler and defensible.
Stacking plans make that consistency visible - helping you:
Confirm total rentable area across all assets
Forecast lease rollover and occupancy exposure
Communicate accurate RSF data to ownership and investors
Part of a Complete Space Accounting System
Stacking plans aren’t a separate service - they’re the reporting layer built on top of our Space Accounting (BOMA) analysis.
Combined with our Field Auditing or As-Built Drawing services, they form a full record of your building’s rentable area and an audit grade documentation trail.
Let’s Bring Your Portfolio Into Focus
If you manage multiple assets—or just one complex property—we can help you align every rentable square foot under a consistent, defensible standard.
